August 30, 2023 | SNAK Consultancy
Share on :
Mastering the Art of Power BI Reporting Analytics: A Step-by-Step Guide

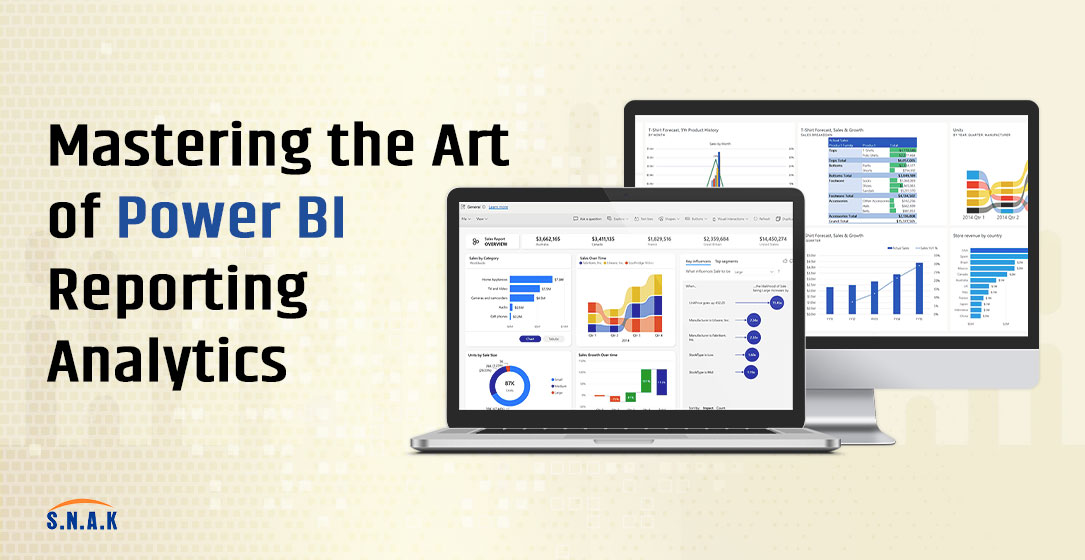
The data-driven decision-making, the ability to transform raw data into meaningful insights is a superpower. Microsoft Power BI, a versatile business analytics tool, empowers users to weave data into compelling reports and interactive dashboards. In this comprehensive guide, we will walk you through the process of creating impactful Power BI reports for advanced analytics.
Step 1: Data Collection and Connection
Every analytics journey begins with data. Power BI supports an extensive range of data connectors, enabling you to pull data from various sources, including databases, cloud services, spreadsheets, and more. Here's how to get started:
1. Connect to Data: Launch Power BI Desktop and click on the "Get Data" button. Choose your data source and establish a connection.
2. Data Transformation: Use Power Query Editor to clean, shape, and transform your data. Filter out irrelevant information, merge tables, and create calculated columns if needed.
Step 2: Data Modeling with DAX
The Data Analysis Expressions (DAX) language is your toolkit for creating custom calculations and measures. DAX can transform raw data into valuable insights. Follow these steps:
1. Learn DAX Basics: Familiarize yourself with DAX functions and syntax. Start with simple calculations and gradually explore more advanced concepts.
2. Create Measures: Use DAX to define measures like totals, averages, and growth rates. Measures provide the foundation for your analysis.
Step 3: Designing Visualizations:
Compelling visualizations are the heart of Power BI reports. They transform complex data into easily understandable insights. Here's how to design effective visualizations:
1. Visual Types: Select appropriate visualizations for your data, such as bar charts, line graphs, maps, and more.
2. Data Visualization Best Practices: Follow guidelines for color selection, data labeling, and layout to ensure your visuals are clear and engaging.
Step 4: Crafting Interactive Reports
Interactivity is what sets Power BI apart. Create reports that allow users to explore data on their terms:
1. Create Report Pages: Divide your report into pages, each focusing on a specific aspect of your analysis.
2. Visual Interactions: Use Power BI's "Edit Interactions" feature to control how visuals interact with each other. This enhances the user experience.
Step 5: Adding Filters and Slicers
Filters and slicers empower users to tailor their analysis. Here's how to implement them:
1. Add Filters: Place filters on your report pages to allow users to focus on specific data segments.
2. Implement Slicers: Slicers provide a user-friendly way to filter data within visuals. Users can easily slice and dice the data for deeper insights.
Step 6: Building Dashboards
Dashboards are a collection of visuals and reports, offering a bird's-eye view of your data. Here's how to create compelling dashboards:
1. Choose Key Visuals: Select the most critical visuals from your reports to feature on the dashboard.
2. Arrange Elements: Arrange visuals on the dashboard canvas for a cohesive and intuitive layout.
Step 7: Sharing and Collaboration
Power BI makes it easy to share your insights with stakeholders and collaborate on data analysis:
1. Publish to Power BI Service: Upload your Power BI reports and dashboards to the Power BI Service for online access.
2. Sharing Options: Choose who can access your reports and whether they can edit or view only.
Step 8: Iterative Refinement
Creating Power BI reports is an iterative process. Collect feedback, analyze usage patterns, and refine your reports over time:
1. Gather Feedback: Listen to user feedback and identify areas for improvement.
2. Monitor Usage: Analyze which visuals and reports are being accessed most frequently to prioritize enhancements.
Questionnaire
Ques.1 What is the structure of an analytical report?
Ans. Traditional types of analytical reports typically consist of a title page, table of contents, introduction, methodology, body section, conclusions, recommendations, and a bibliography
Ques.2 What are the 3 main types of analytical reports?
Ans. There are three types of analytics that businesses use to drive their decision making; descriptive analytics, which tell us what has already happened; predictive analytics, which show us what could happen, and finally, prescriptive analytics, which inform us what should happen in the future.
Ques.3 How do I Analyses data?
Ans. Step 1: Define your goals.
Step 2: Decide how to measure goals.
Step 3: Collect your data.
Step 4: Analyze your data.
Step 5: Visualize and interpret results.
Conclusion
With this step-by-step guide, you're equipped to dive into the world of Power BI reporting analytics. Remember, the key to success lies in practice and continuous learning. As you explore different data scenarios and experiment with advanced DAX calculations, you'll unlock the true potential of your data and unleash insights that drive your business forward. Power BI isn't just a tool; it's a journey towards data enlightenment.